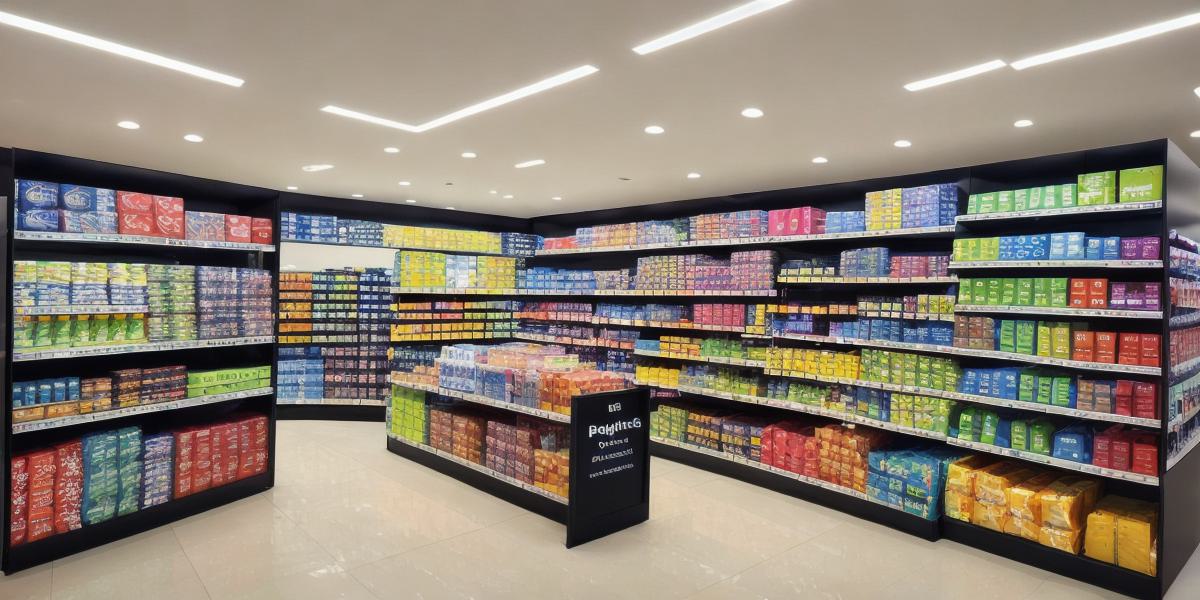
How to Read a Planogram: A Comprehensive Guide
As businesses continue to grow and expand their product lines, it becomes increasingly important to optimize inventory management and ensure that products are displayed effectively in-store. One of the most effective ways to achieve this is by using planograms, which are visual representations of how products should be arranged on store shelves. In this comprehensive guide, we will explore everything you need to know about reading and interpreting planograms, from the basics of layout and design to advanced strategies for maximizing sales and increasing customer engagement.
What is a Planogram?
A planogram is a two-dimensional representation of how products should be displayed on store shelves. It takes into account factors such as product size, shape, and weight, as well as the available shelf space and customer behavior. By using a planogram, businesses can ensure that their products are displayed in an optimal way that maximizes sales and increases customer satisfaction.
The Importance of Planograms
Planograms are critical to the success of any retail business. They help businesses optimize inventory management by ensuring that products are displayed in a way that is easy for customers to find and purchase. Additionally, planograms can help businesses increase sales by highlighting top-performing products and creating visual focal points that draw customers’ attention.
How to Read a Planogram
Reading a planogram can seem daunting at first, but with a little practice, it becomes much easier.
Here are some key things to keep in mind when reading a planogram:
- Understand the Layout and Design: The layout and design of the planogram should be easy to read and understand. Look for clear visual cues such as lines, grids, and color-coded zones that help guide your eye through the plan.
- Identify Key Products: Planograms often include key products that are essential to the success of the business. These products should be displayed prominently and in easy-to-reach locations.
- Consider Customer Behavior: Understanding customer behavior is critical when reading a planogram. Look for areas where customers tend to congregate and place high-value products in those locations to maximize sales.
- Evaluate Product Placement: Pay attention to how products are placed on the shelves. Products should be arranged in a way that makes sense and is easy for customers to navigate.
- Analyze Sales Data: Finally, always analyze sales data when reading a planogram. This will help you understand which products are performing well and which ones need to be moved or promoted.
Real-Life Examples of Effective Planograms
To help illustrate the power of planograms, let’s take a look at some real-life examples of effective planograms:
- Walmart’s Electronics Department: Walmart’s electronics department is a great example of how planograms can be used to maximize sales. The department is arranged in a way that makes it easy for customers to find the products they are looking for, with high-value items displayed prominently in easy-to-reach locations.
- Target’s Beauty Department: Target’s beauty department is another great example of how planograms can be used to increase customer engagement. The department is arranged in a way that creates visual focal points, with bright colors and eye-catching displays that draw customers’ attention.
- Whole Foods’ Produce Section: Finally, Whole Foods’ produce section is an excellent example of how planograms can be used to optimize inventory management. The section is arranged in a way that makes it easy for customers to find the products they are looking for, with fresh produce displayed prominently and in easy-to-reach locations.
FAQs
1.
